
Mastering the Art of Reading Trading Charts: A Beginners Guide
Trading can be a daunting world to enter, but with the right knowledge and resources, it can also be an exciting opportunity for financial growth. Understanding trading charts and setting up an open trading account are crucial aspects of trading. In this blog post, we will guide beginners step-by-step, giving a curated guide to understanding trading charts and setting up an open trading account.
Understanding Trading Charts
Before delving into the different parts of a trading chart, it’s essential to understand what a trading chart is. Simply put, a trading chart is a graphical representation of a financial asset’s price history, which traders use to analyze the market and make informed trading decisions.
Types of Trading Charts
Trading charts come in different types, and the chart type used will depend on the trader’s preference. Some of the most commonly used trading charts include:
- Line Chart: A line chart connects the closing prices of an asset over a specific time to form a line. It’s ideal for general trending information.
- Candlestick Chart: A candlestick chart is a chart utilizing candles and wicks to represent an asset’s price action over an isolated time frame.
- Bar Chart: A bar chart shows the opening and closing prices of an asset using bars with small horizontal lines both sides to show the opening price on the left and closing price on the right.
Reading the Different Parts of a Trading Chart
The three primary parts of a trading chart are price, time, and volume. Understanding these elements is essential for analyzing trading charts. Breaking down these parts will make it easier to understand how to read a trading chart.
Price:
The price part of a trading chart refers to the current asset’s price at any given time. The price can be represented in different forms such as lines, bars or candlesticks. Traders use the price information to make decisions on when to buy or sell the asset.
Time:
The time part of a trading chart represents the timeframe of the asset’s price history. Time can be displayed in a variety of time increments such as minutes, hours, days, weeks, months, or years.
Volume:
Volume is the measurement of the total number of assets traded within a given period, usually a day. An increase in volume indicates a higher demand for the asset, and a decline in volume indicates weaker demand.
Common Trading Indicators to Include on Charts
Trading indicators are graphical displays used to analyze asset price. They enable traders to make more informed trading decisions and increase the chances of success. Here are some of the most commonly used trading indicators:
- Moving Averages: This indicator looks at past price trends to determine the asset’s average price over a specified period.
- Relative Strength Index (RSI): A tool for assessing an asset’s strength and spotting overbought or oversold conditions is the relative strength index (RSI).
- Bollinger Bands: Bollinger bands measure an asset’s volatility and help traders predict potential price changes.
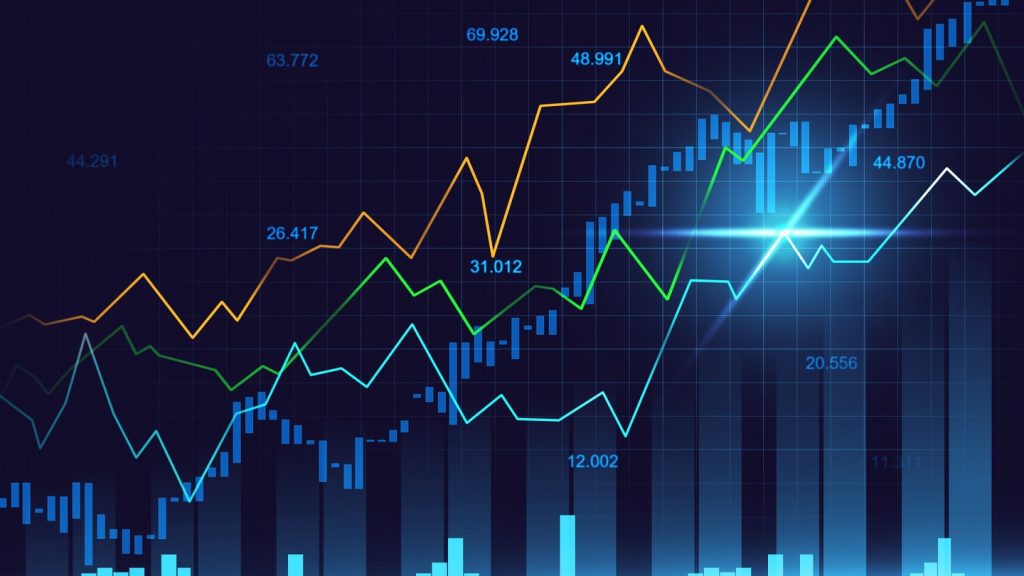
Examples of Different Trading Charts with Indicators
A visual representation can make it easier to understand how trading charts and indicators work. Here are some examples.